- Published on
Safari Web Inspector vs Chrome Developer Tools vs Firefox Browser Tools
- Authors
- Name
- interglobalmedia
- @letsbsocial1


I just found out why some developers prefer working with Chrome Developer Tools, some prefer working with Firefox Browser Tools, and some prefer Safari Web Inspector. And it is not necessarily for the “obvious” reasons.
Until very recently, I preferred working with Chrome Developer Tools, because I considered the DX (developer experience) the most intuitive. In that sense, it still is. However, I have also very recently been getting “unknown” notifications from Chrome, which I absolutely know must be from “phishing” sites. And that is NOT good and NOT secure.
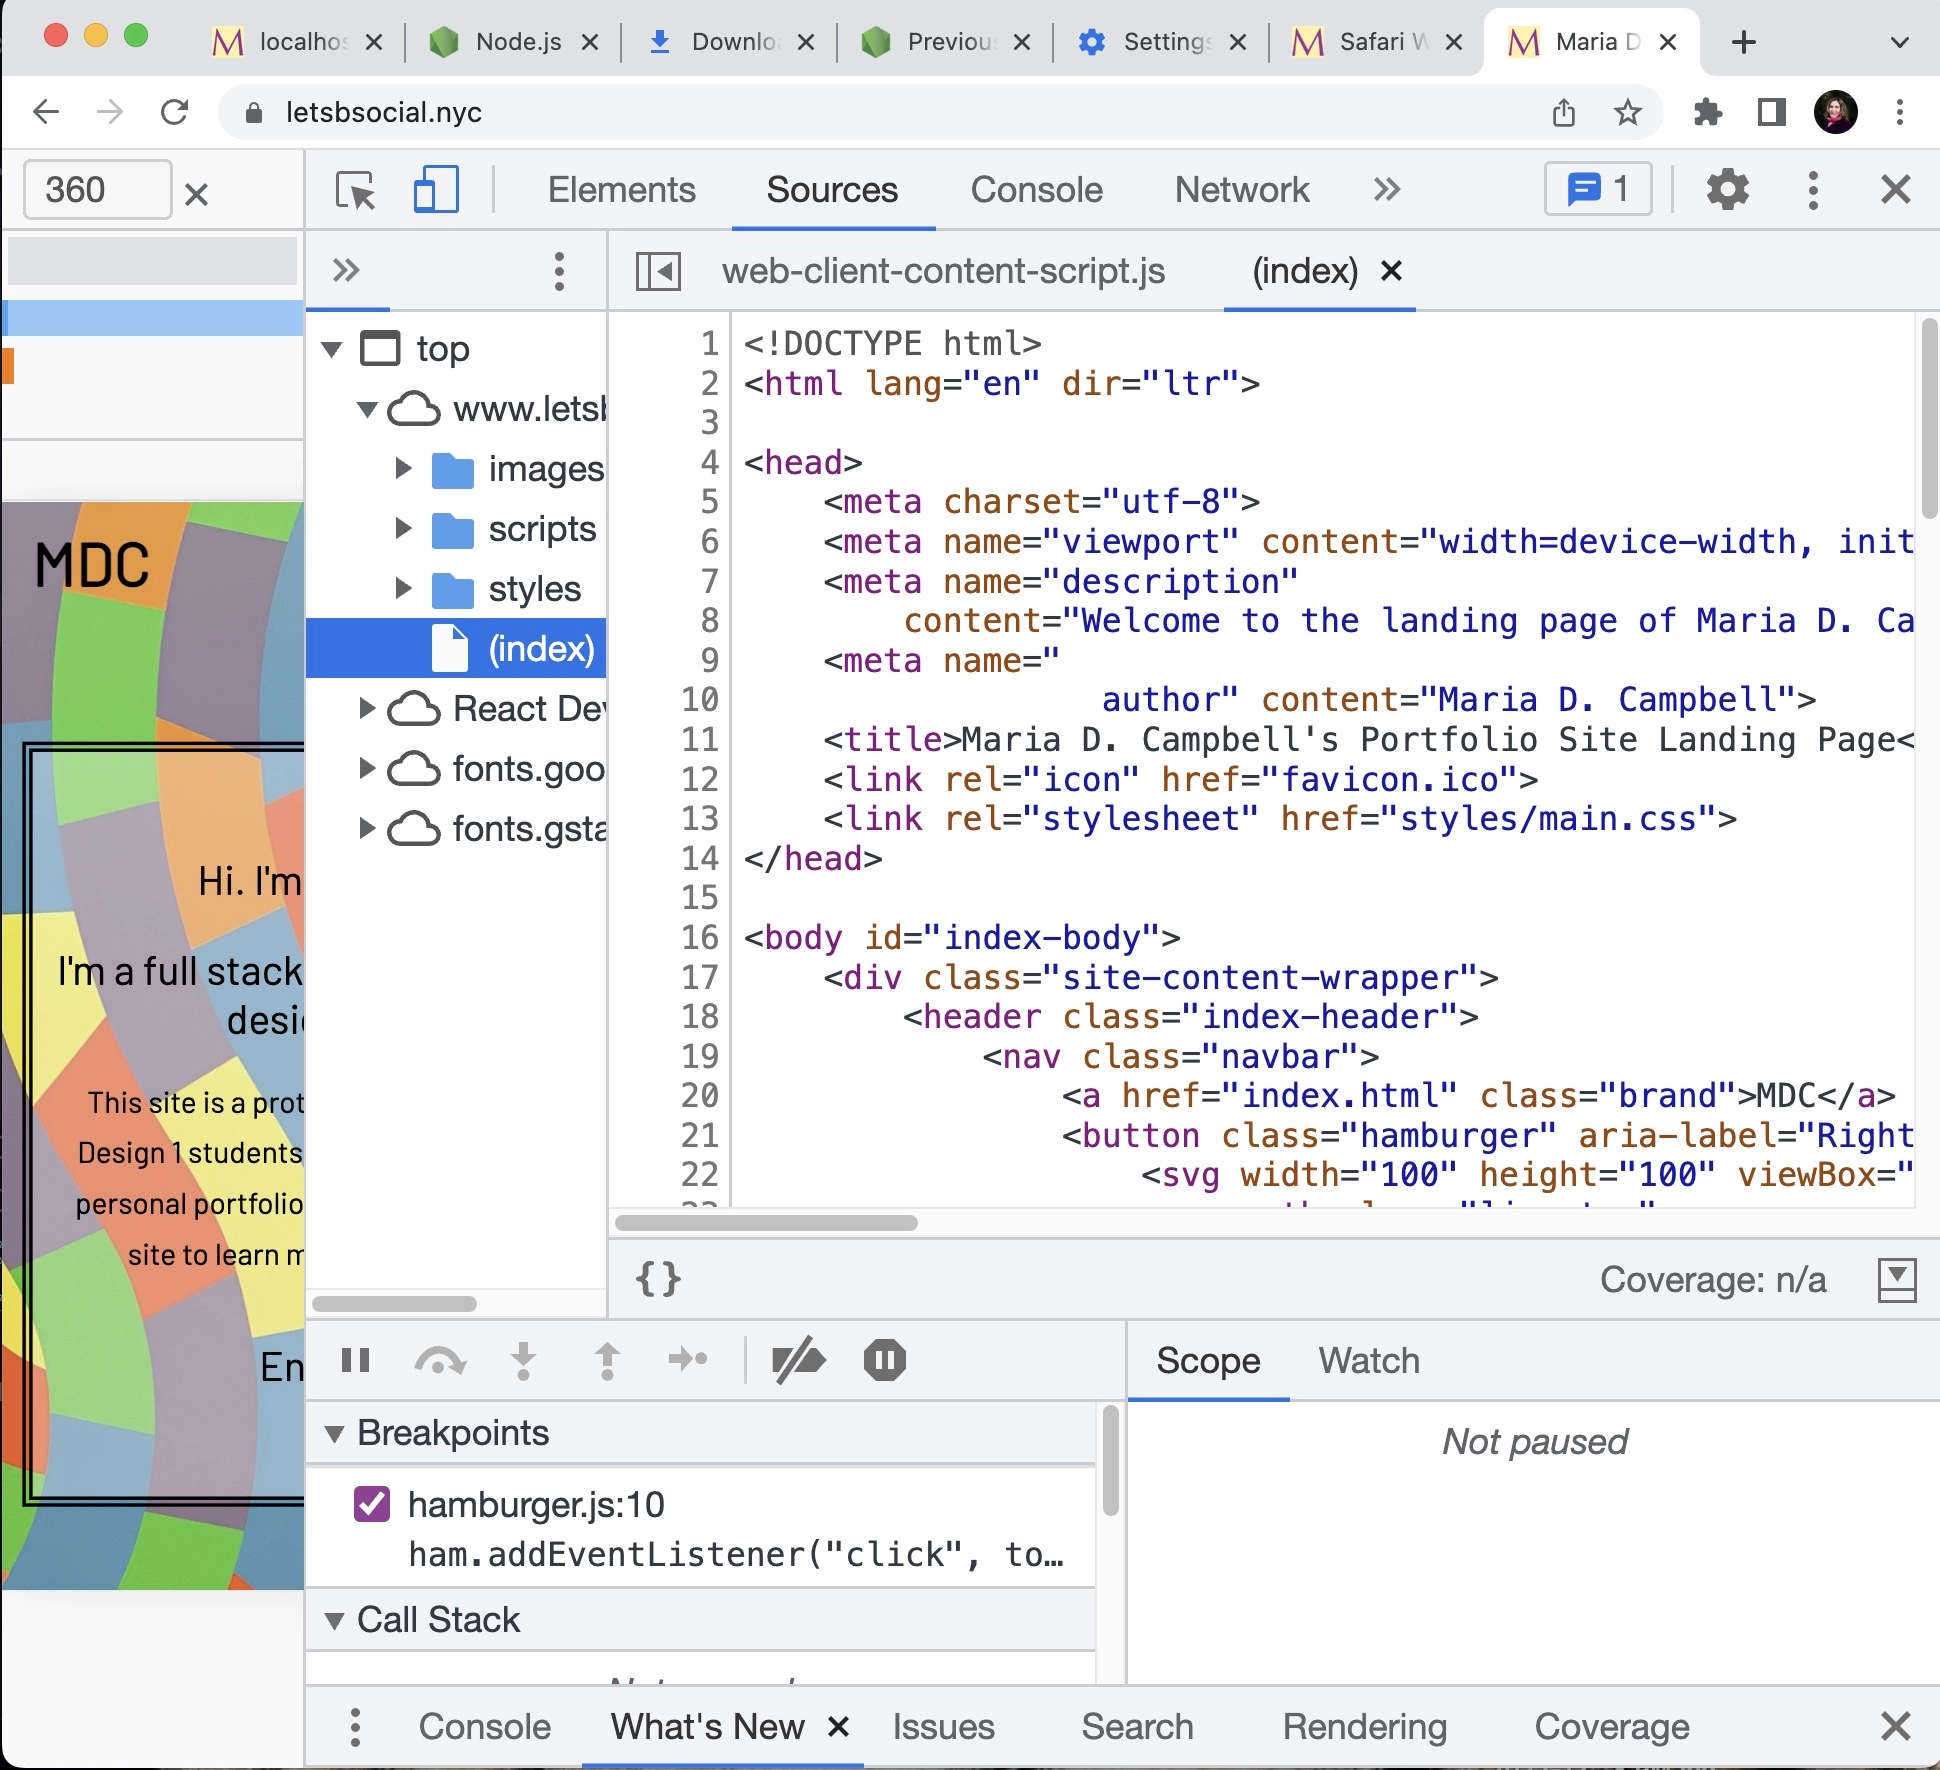
Below is a screenshot of Chrome Developer Tools when I go in using the Option + Command + J short cut and select the Sources tab:
Then I started using Firefox. That definitely is more secure and private, but the DX is not the best as far as their browser tools go. AND there is no Chrome Sources tab equivalent. Which just did not seem to initially work for me.
Then I checked out Safari. They are much better than they used to be, and they DO have a Chrome Sources tab equivalent. I think I will be working between Firefox and Safari. Chrome has to go, except for when testing for cross-browser compatibilities. AND when I use Safari or Firefox to land on sites which are asset heavy, i.e. lots of images that have lazy-loading implemented, the Lighthouse audit in Firefox is double the score of Chrome, and load time in general is very quick in Safari. That is because of all those Chrome background trackers and plugins that exist in the browser, and which can severely damage site performance.
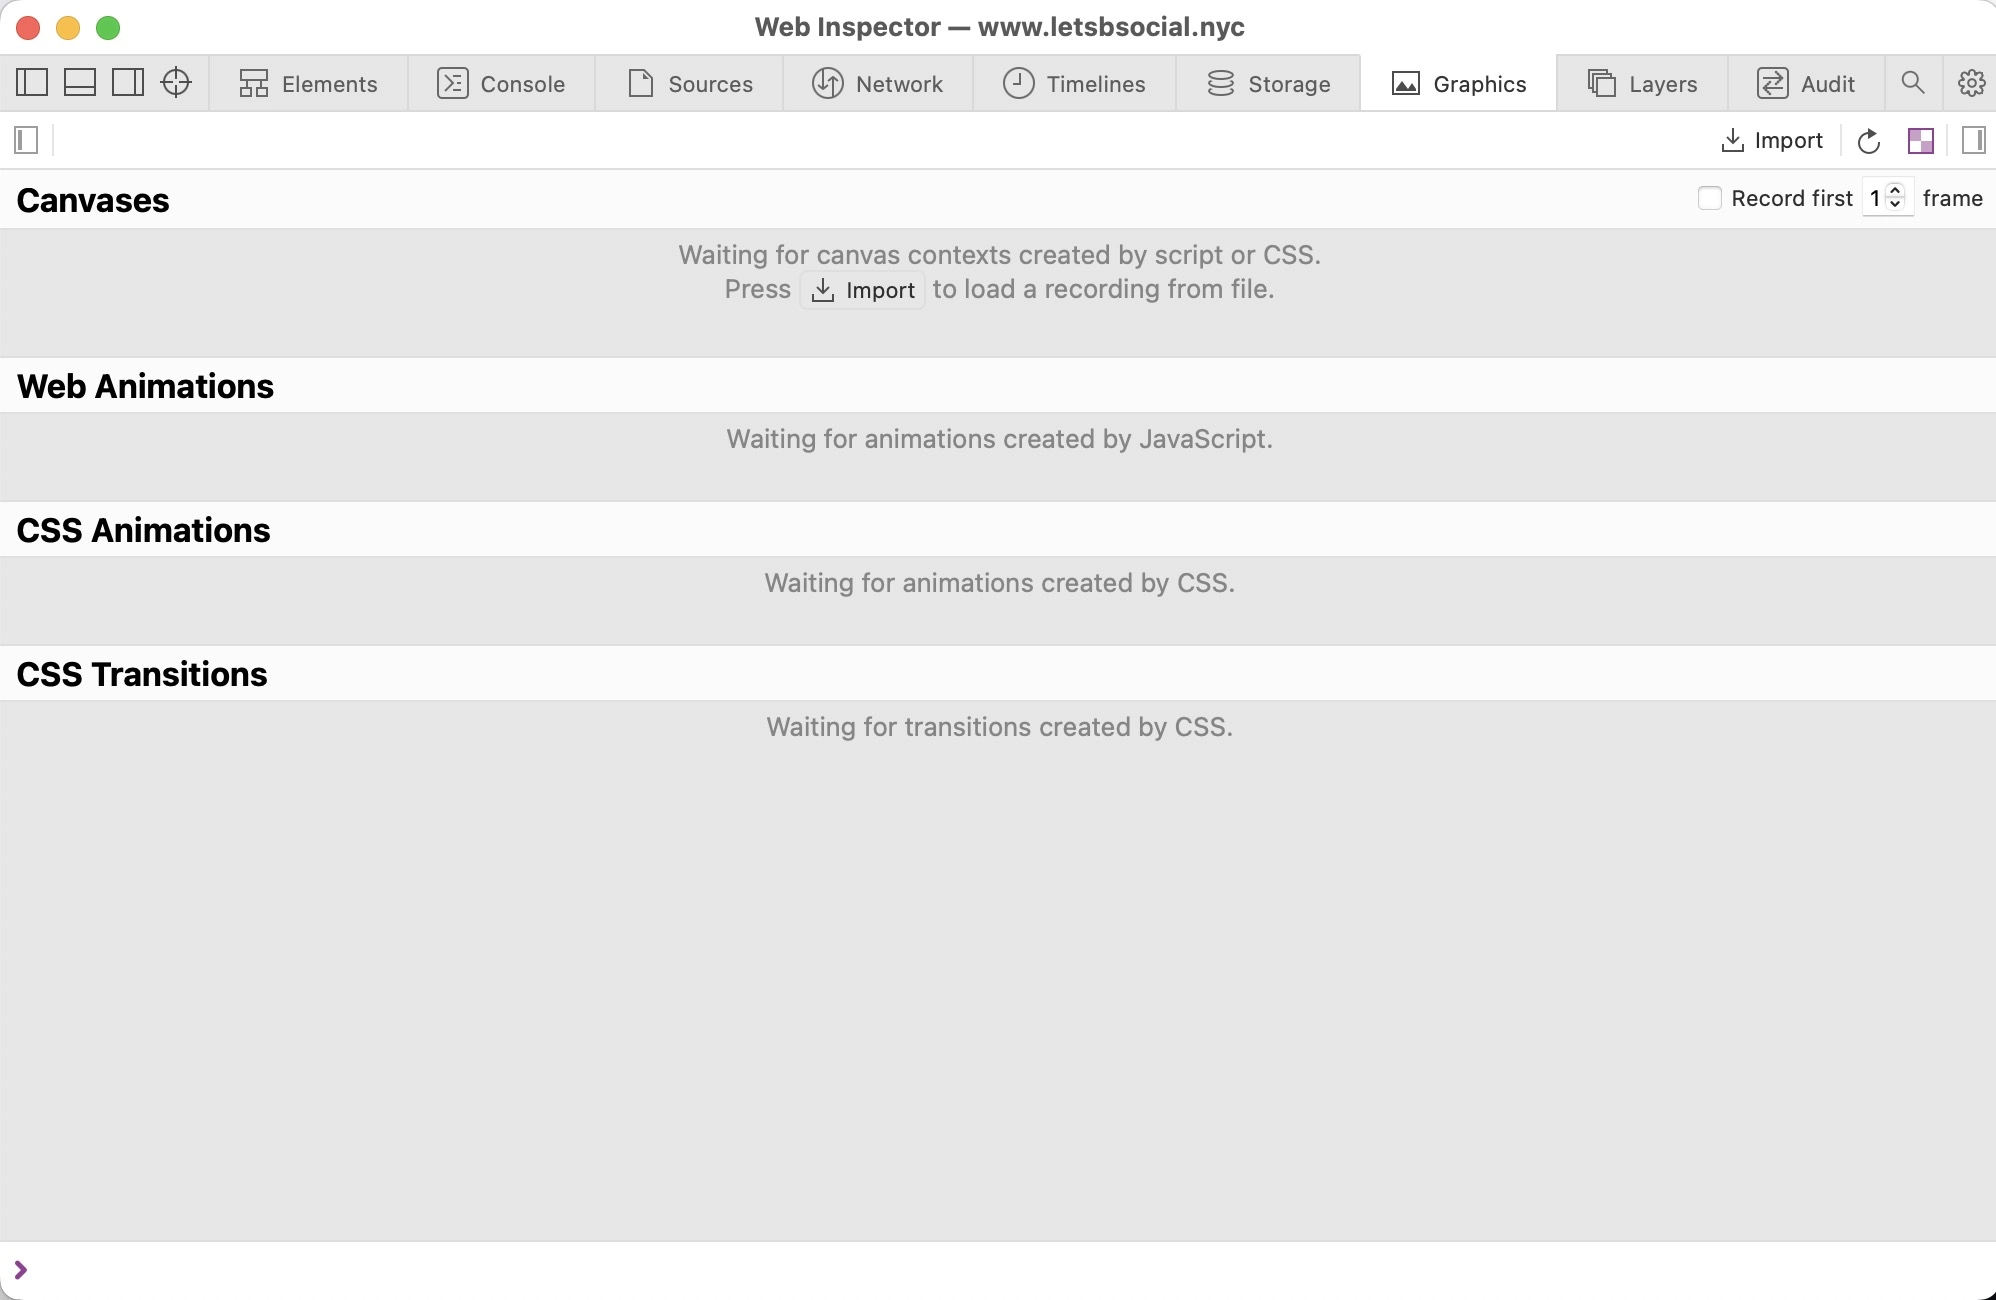
This is what Safari Web Inspector looks like:

What I do like about Safari is that ALL ASSETS used on a page are listed and can be fully inspected, including things like Google Fonts, for example. The screenshot above is the home page of the example site I created for my Web Design 1 class (my last class teaching it will be next Wednesday, December 14, 2022, freeing myself for a next “adventure”), and on that page I have a background image, Google Font(s), two JavaScript files which reside in a scripts folder, a main.css file which resides in a styles folder, and then a CSS2 file for my Google Font. And all this appears under the Web Inspector Sources tab, the equivalent of the Chrome Developer Tools Sources tab. But perhaps even better, because the Web Inspector also opens up in a new window, which makes working inside the Inspector much easier! What is ALSO very cool is that Safari also has a Graphics tab:
Of course my Graphics tab does not show anything on the Home page of this site because there is nothing going on animation-wise there. However, when I go to the about.html page of the site, it is a different story. There, I have added (3) animation layers:
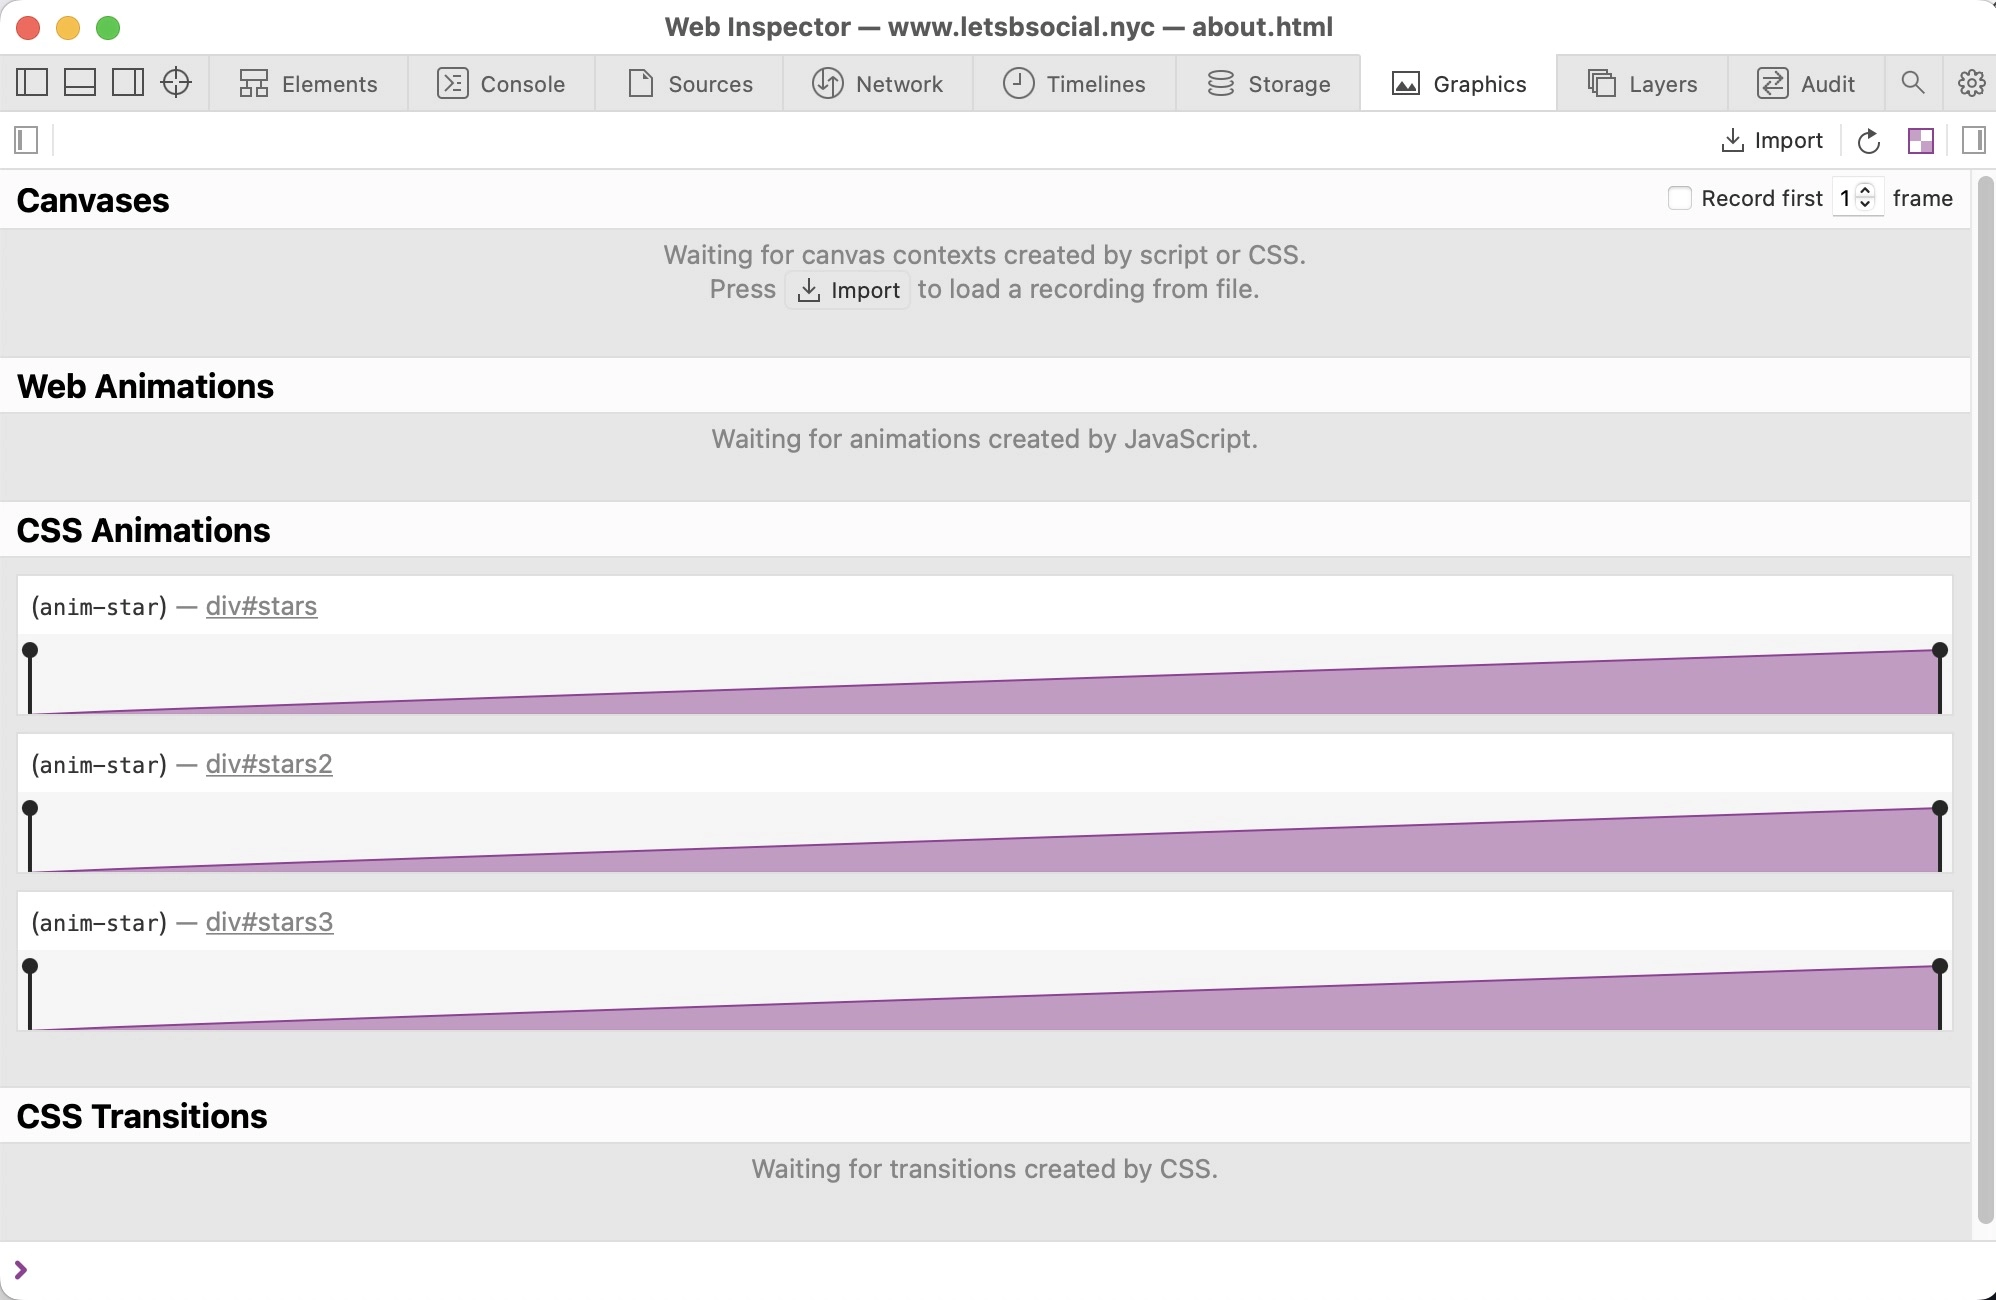
And it even states where the animation is defined in the HTML markup, and the name of the animation in the CSS code. How cool is that?
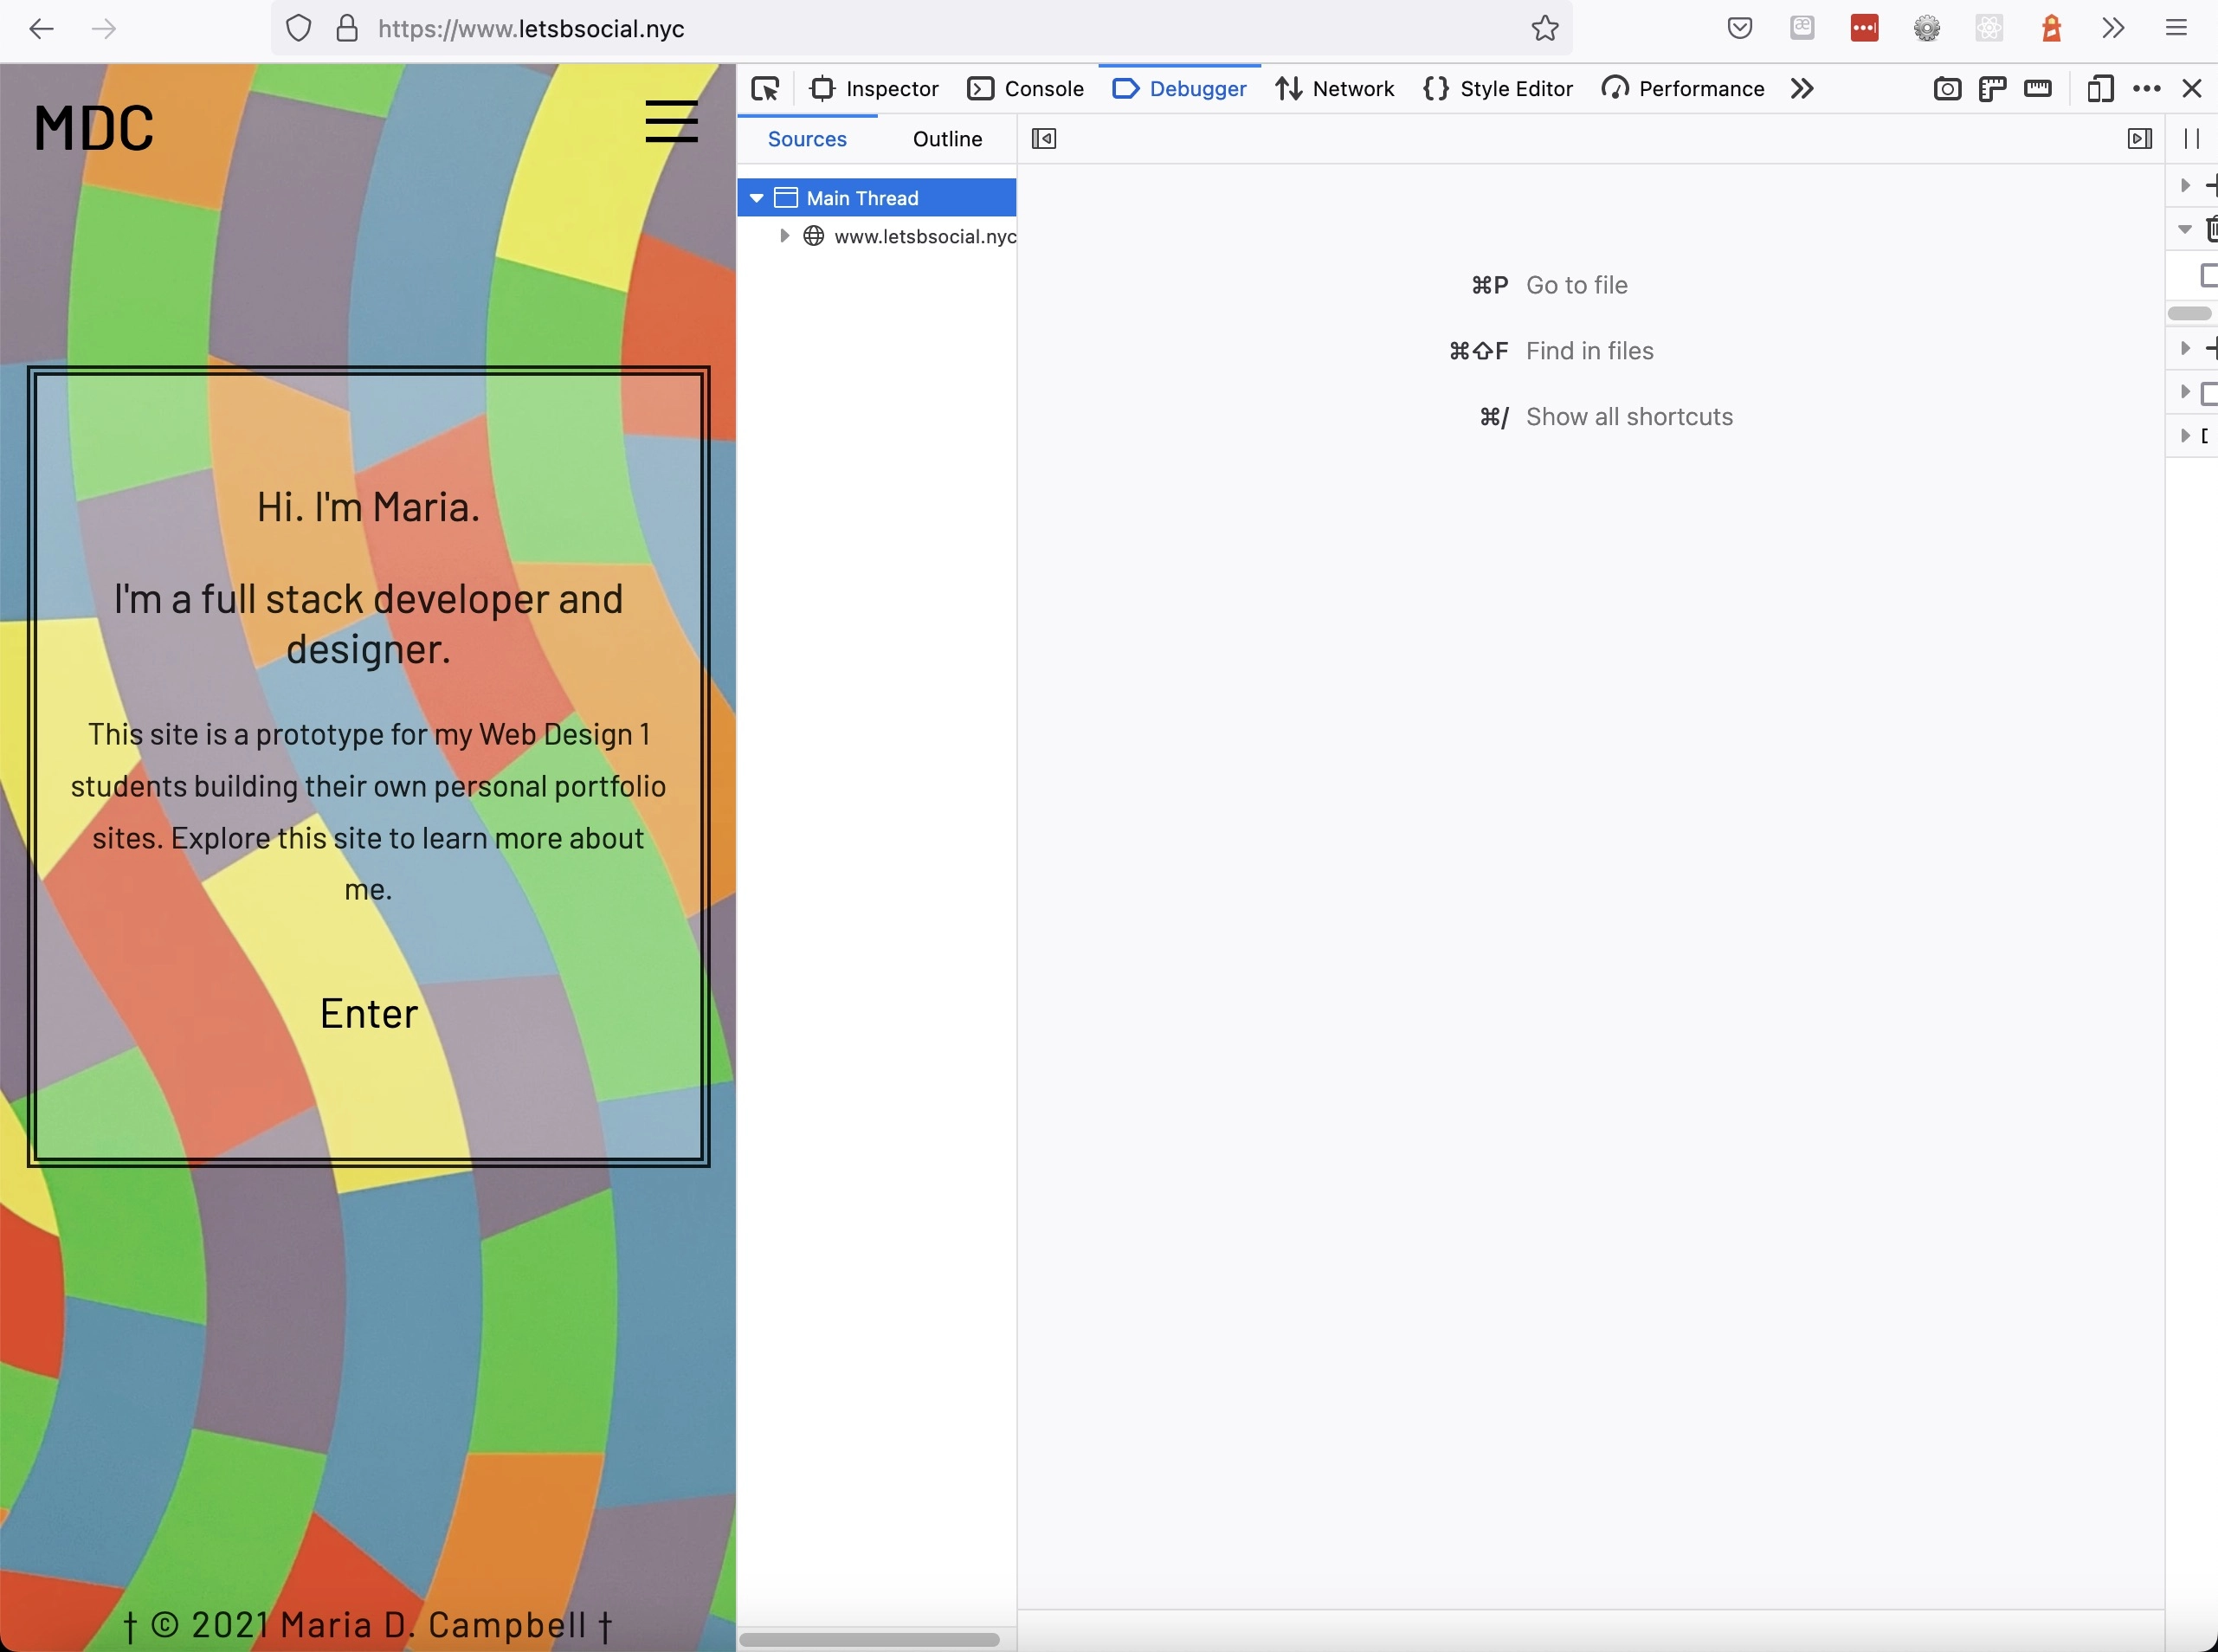
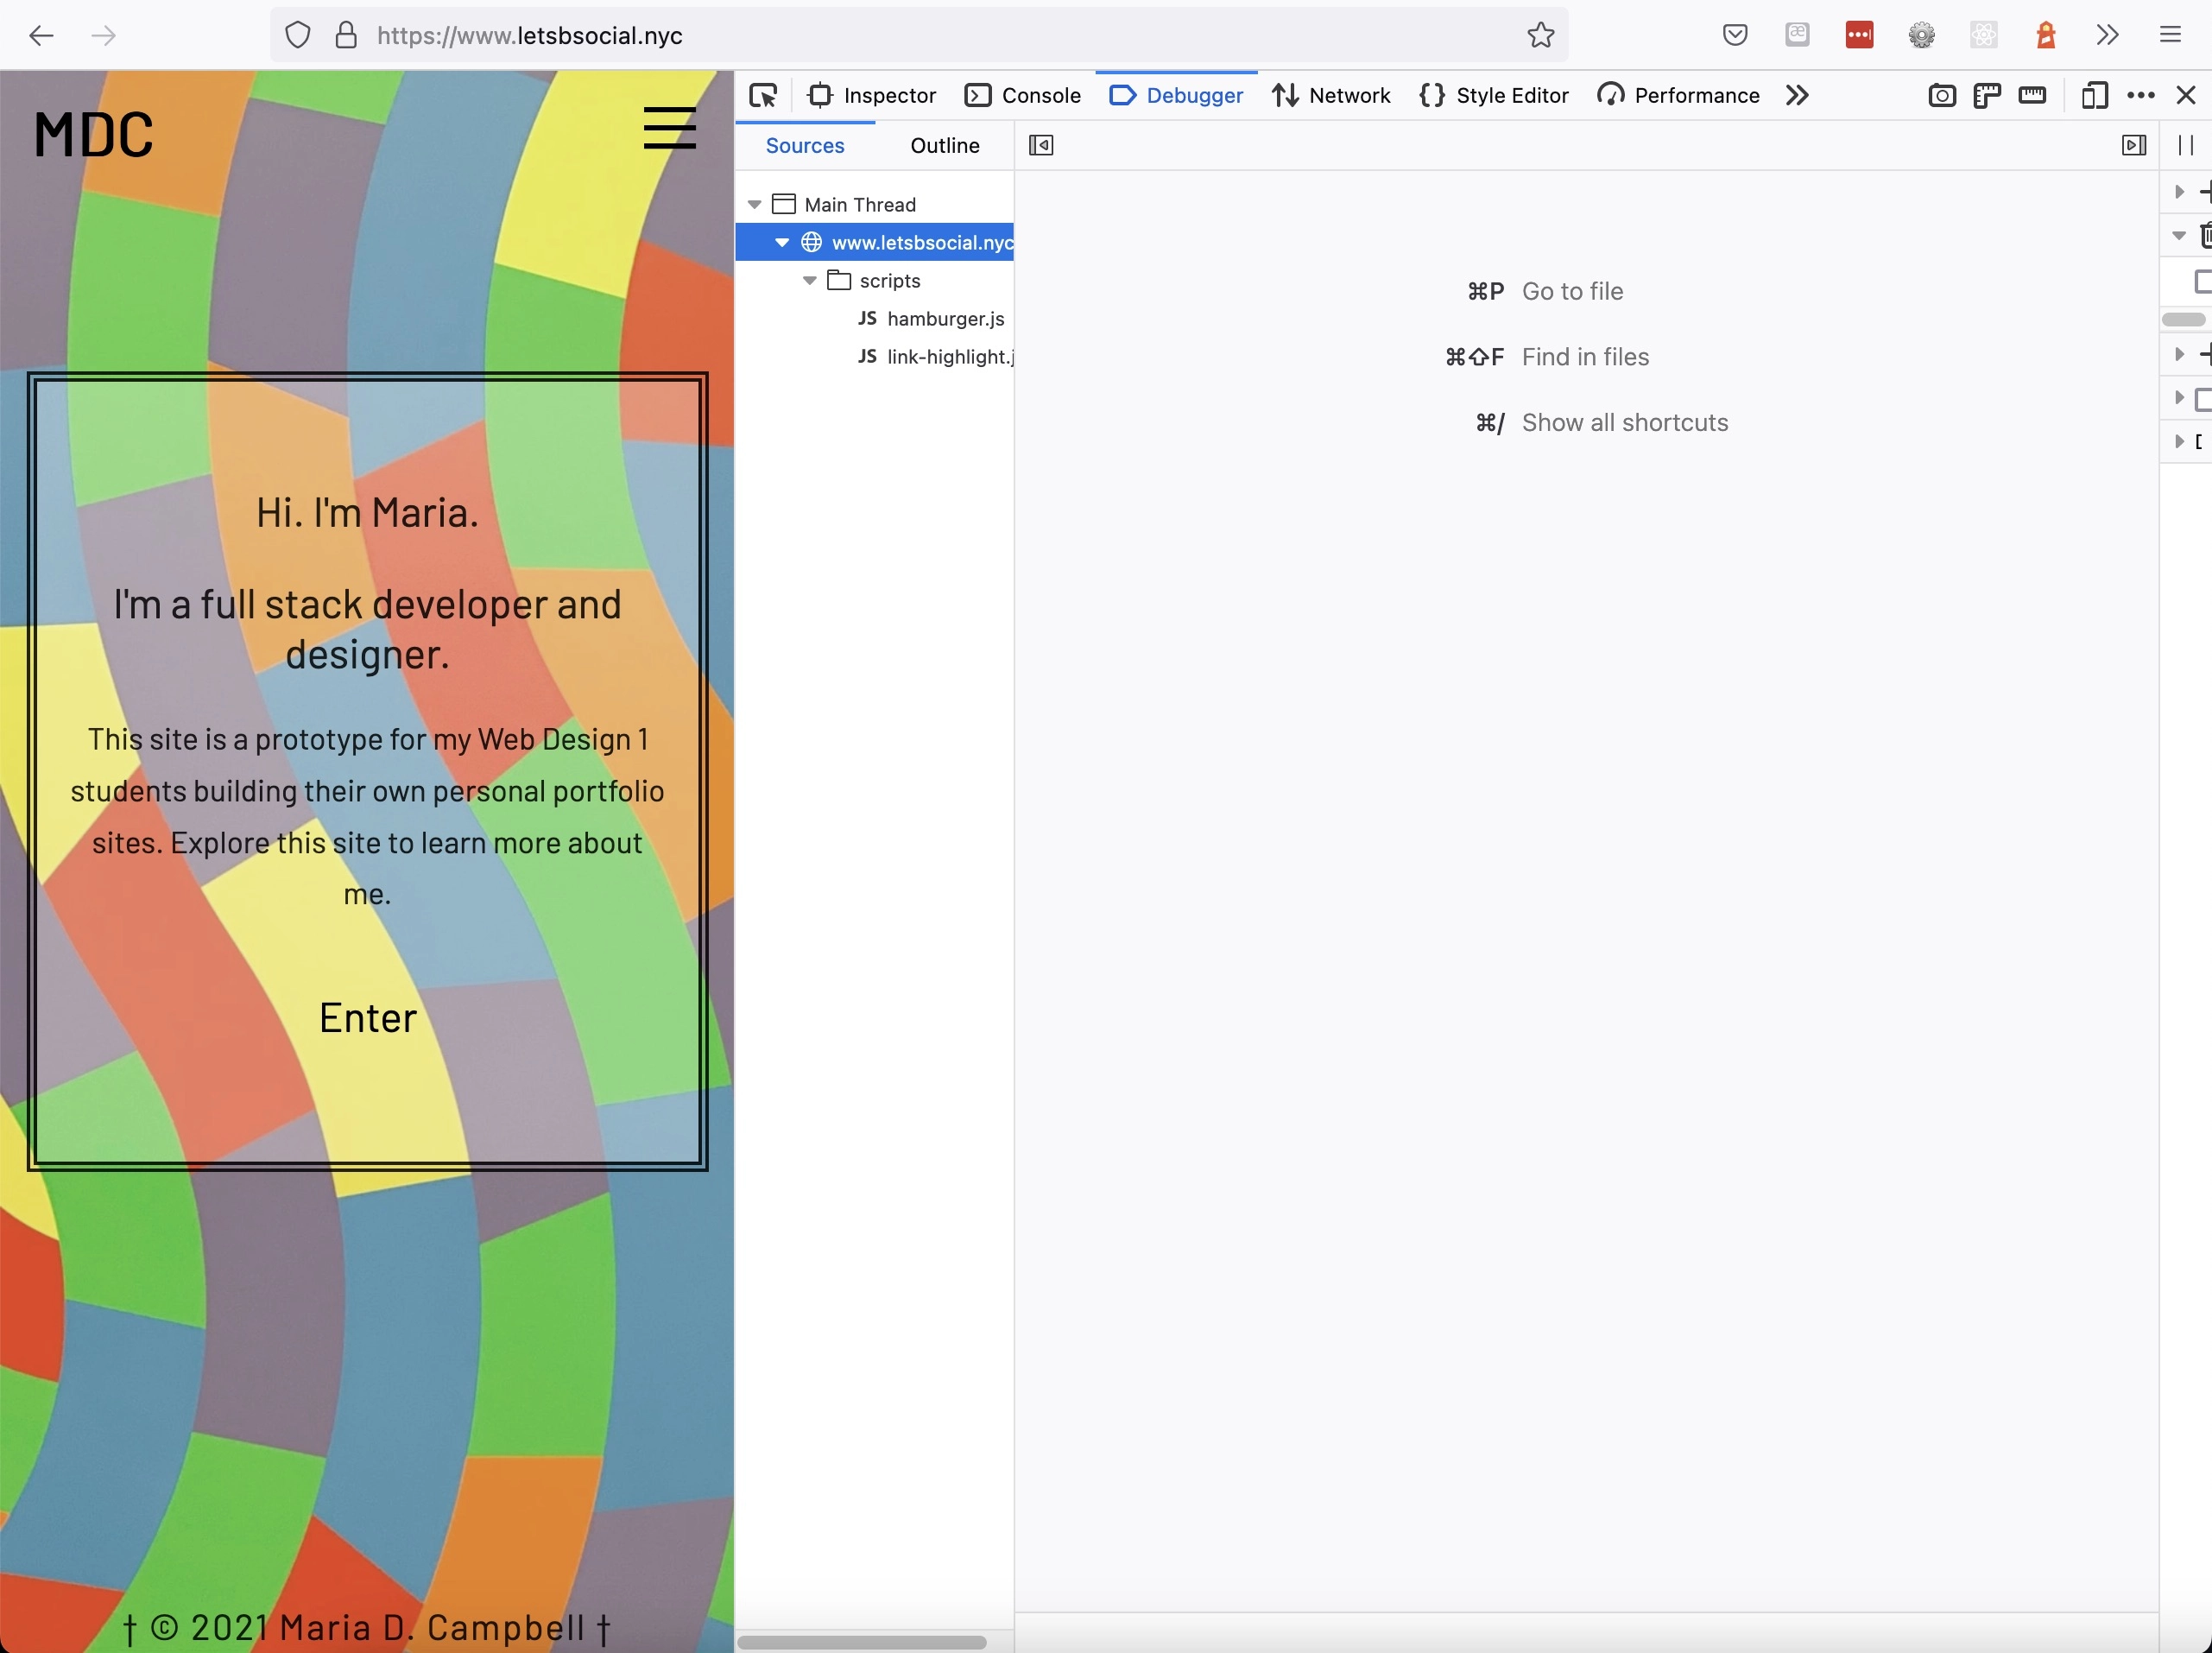
Now let’s take a look at Firefox. The DX there is not as intuitive:

I actually had to look up how to find the JavaScript files driving a page: Introduction to Firefox Debugger.
I went into the Firefox Browser Tools, and then selected the Debugger tab. Then I opened up “Main Thread” by clicking on its dropdown arrow, and inside was the link to the page I was on:
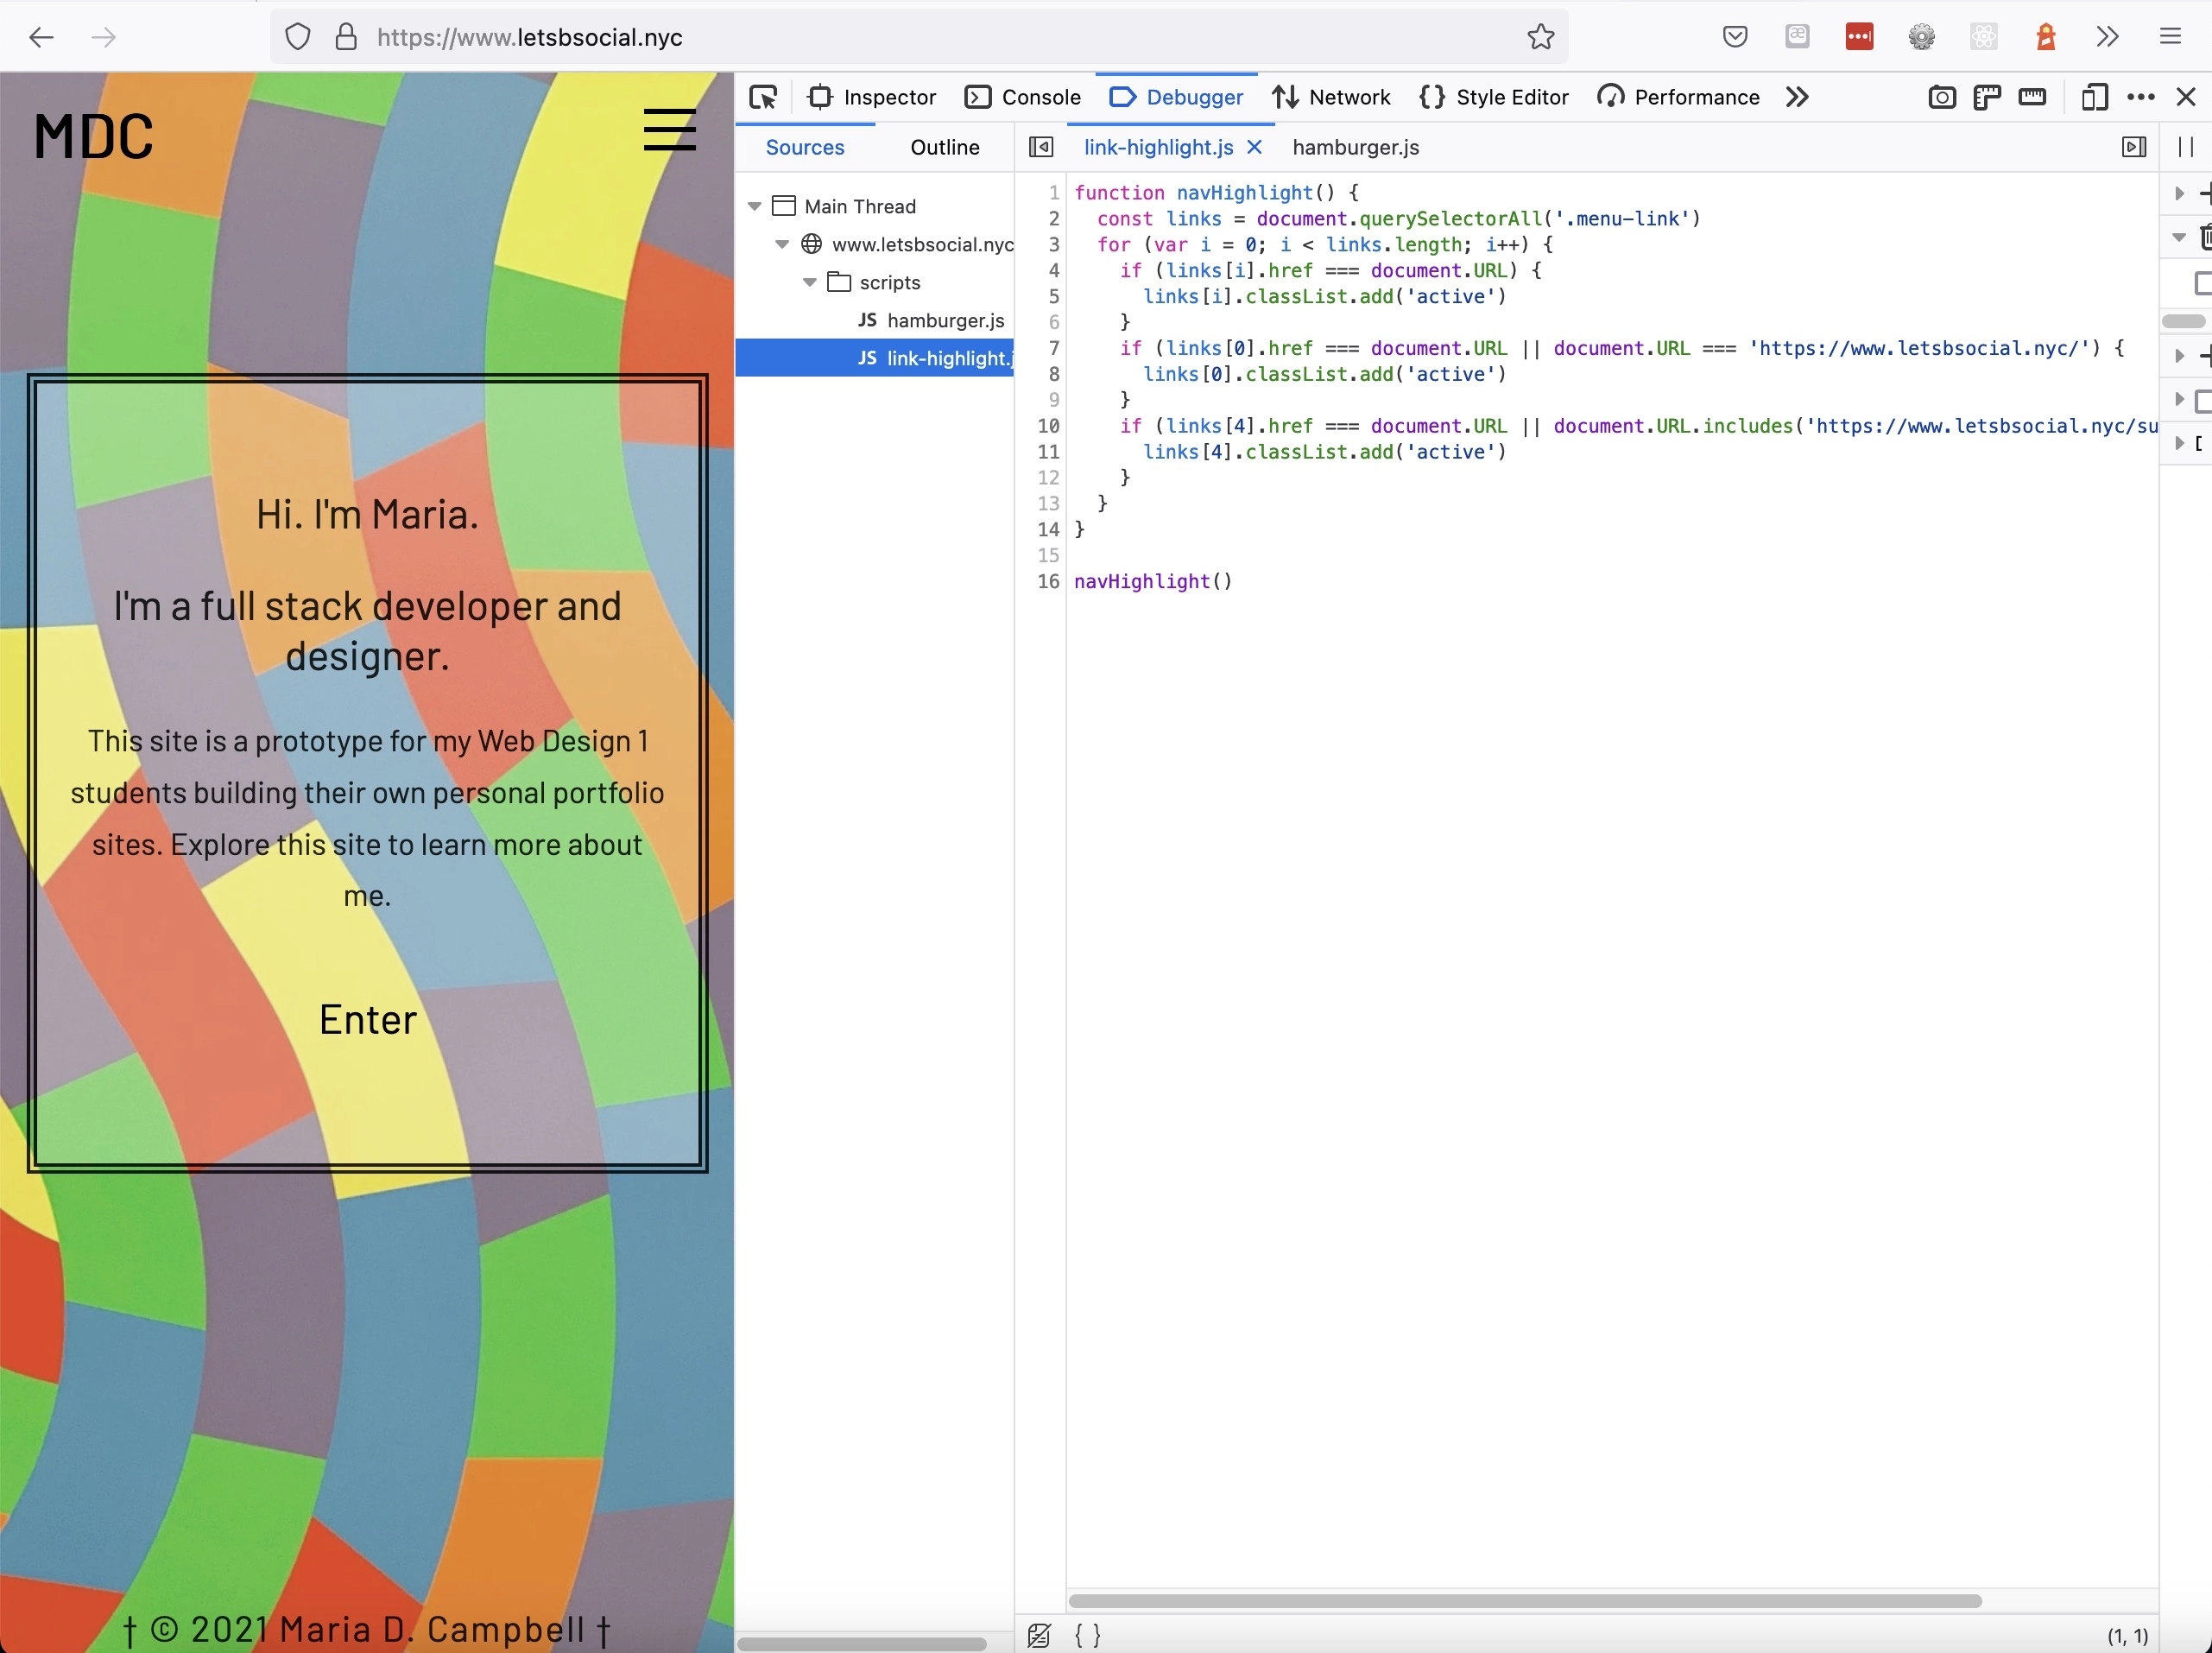
Then I clicked on the site url, and the following appeared:
My scripts folder containing the JavaScript files which were being used on the active page with the help of script tags located right above the closing body tag in the HTML markup. And when I clicked on one of the files, the following appeared:
So yes, we can get to the same places in all three browsers, but the paths and experiences getting there are dramatically different. After better acquainting myself with Firefox and Safari, I could see using both. And device mode (responsive design mode) in Firefox definitely competes well against Chrome. It might be even better!
Sometimes we stick with tools which may not be the safest or not the best for site performance because we don’t know any better or we are resistant to change. But if we just take a bit of time to get to know the competition, we just might find happiness in switching!
Happy Developer Tooling across browsers!